


Passionate about solving your toughest challenges.
Since 1946, we have pushed the limits of science and technology to solve the most complex filtration, separation and purification challenges.
Looking for a solution to a complex challenge? Find it here.
Energy Transition at Pall
Building a truly sustainable future requires an overhaul of complex processes, across the globe. Discover how Pall's holistic approach helps unlock critical solutions in carbon capture, energy storage (batteries), hydrogen, and bio-fuels production - to enable a greener planet and better world.
Supralon® Replacement Oil Filter Elements
With high efficiency and consistent performance, our Supralon Filter Elements enable customers to rapidly achieve and maintain required cleanliness levels that protect lube and hydraulic systems against component failure and unscheduled downtime that can cost tens of thousands of dollars per hour.
The unsolvable, solved.
Through our filtration, separation and purification expertise, we collaborate with customers to solve their most complex challenges. From safeguarding health and protecting critical assets to improving quality and minimizing emissions and waste.
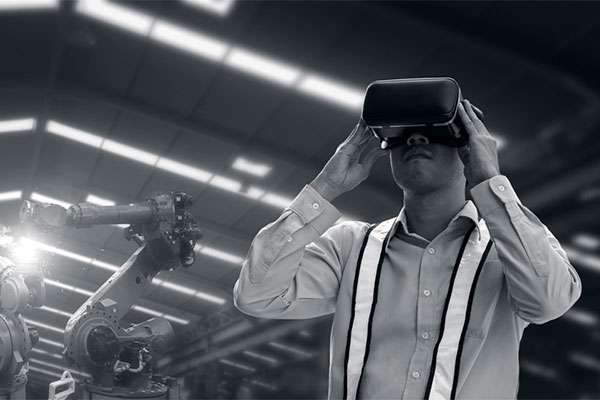
Pall technology plays a critical role.

Redesigning critical processes to help build a truly sustainable future.
Building a truly sustainable future requires an overhaul of complex processes, across the globe. Discover how Pall’s holistic approach unlocks critical solutions—to enable a greener planet and better world.
We push the limits of what's possible to drive efficiency and quality.
Pall technologies can handle beers at different filterability levels. Intelligent processes, innovative designs and advanced membrane cleaning provide smart solutions for constant and low cost.
Applying Pall’s beer filtration expertise to beer-making helps to reduce risk and enable the necessary process control.
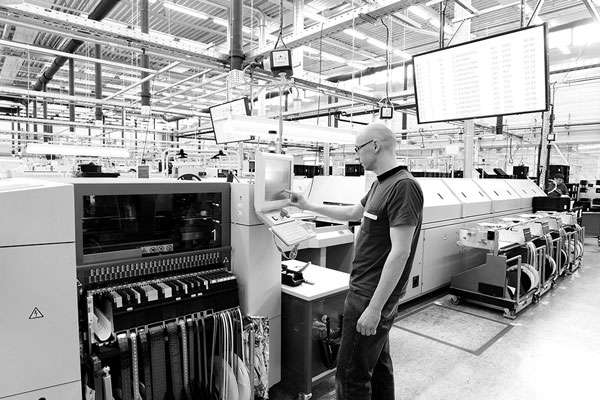
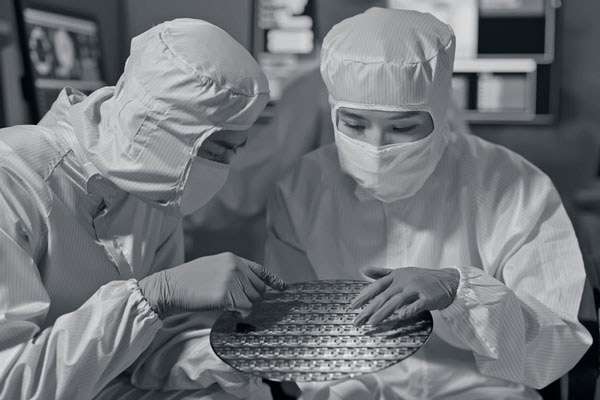
The leader in purification and filtration technology for semiconductors.
Pall offers innovative purification and filtration technologies for new and expanding markets, leading the way with consistent, reliable performance for state-of-the-art cleaning methods and manufacturing processes.
Semiconductor manufacturers choose Pall filtration and purification products for their process-enabling features, quality, cost reduction and productivity improvements.
No one knows aerospace filtration technology the way we do.
We can help you meet stringent performance, reliability and maintainability requirements so that you can continue delivering the highest possible value to your customers.
Never miss the latest news and offers
Ready to receive industry insights from Pall Corporation?